Email Platform Monitoring: What You Need to Know
Any telco, ISP or hosting provider that runs a customer email platform, knows that email platform monitoring is vital to the stability of both their email service and their sanity. Email, a source of identity and an invaluable knowledge repository, is the lifeblood of communications for so many people. No organisation wants to answer to hundreds, thousands, if not millions of angry end users whose email is offline or lost. To try to avoid that, it is important to apply effective monitoring across your entire range of email services deployed.
Monitoring and Alerting
Before we start, let’s clarify the difference between monitoring and alerting.
Monitoring is referring to the use of software to collect statistics and information about a system and software’s state over a period of time.
Alerting (or ‘alert messaging’ or ‘alert notification’) is covering, according to Wikipedia, “the machine-to-person communication that is important or time sensitive”.
At times, when certain events are not being responded to immediately, we get asked, “But don’t you monitor this?”
Well, yes, but it isn’t always about monitoring. What really matters is getting that alert generated under the right conditions – and any email service provider will tell you that mastering ‘the right conditions’ for the alert flow is more difficult than most people realise.
This post will look at what makes up a good monitoring and alerting solution, as well as how to ensure that it gets improved on an ongoing basis.
Monitoring
Mail services are made up of many different components, including Mail Transfer Agents (MTAs), Mail Delivery Agents (MDAs), mail stores, client access services, databases, caches, Domain Name System (DNS) look up services, administration interfaces, and usually a webmail application.
The technologies involved can take a broad range, and the deployment models can have big differences, depending on the location (e.g. cloud versus on-premises) and the size of the installation.
If you call a meeting to discuss monitoring with your team, I would expect there to be a utopian solution on the whiteboard quite quickly, which can seem overwhelming and result in total abandonment of the idea, because it is (understandably) too big a project.
In order to keep things manageable, we recommend that you approach monitoring on a per component basis. If you break it down by component, you can then chip away at adding basic items quite quickly. Once those basics are covered, you can look at the slightly bigger picture and implement the next level of monitoring.
Alerting
Once a component is generating data, additional work is required to enable alerting. A decision for each component needs to be made in order to identify when the data generated indicates a problem with the particular component.
This can be done via an individual metric threshold, or a combination of multiple data points. Once the threshold is identified, the component needs to generate some sort of event that goes into the alerting service for further processing. We would recommend at the minimum, an event identifier (for instance, MTA queue level) and a severity (for example, warning).
What issues can monitoring identify?
Monitoring can help identify the following key issues (and more):
- Running out of capacity.
- For instance, disks usage in a mail system will always increase. Most people read email and then leave it on the server forever. Even if you regularly purge spam and trash folders, the overall usage will still increase at a steady pace. Having good disk monitoring in place can give you an early warning on when you might run out of disk space and need to add capacity to the infrastructure.
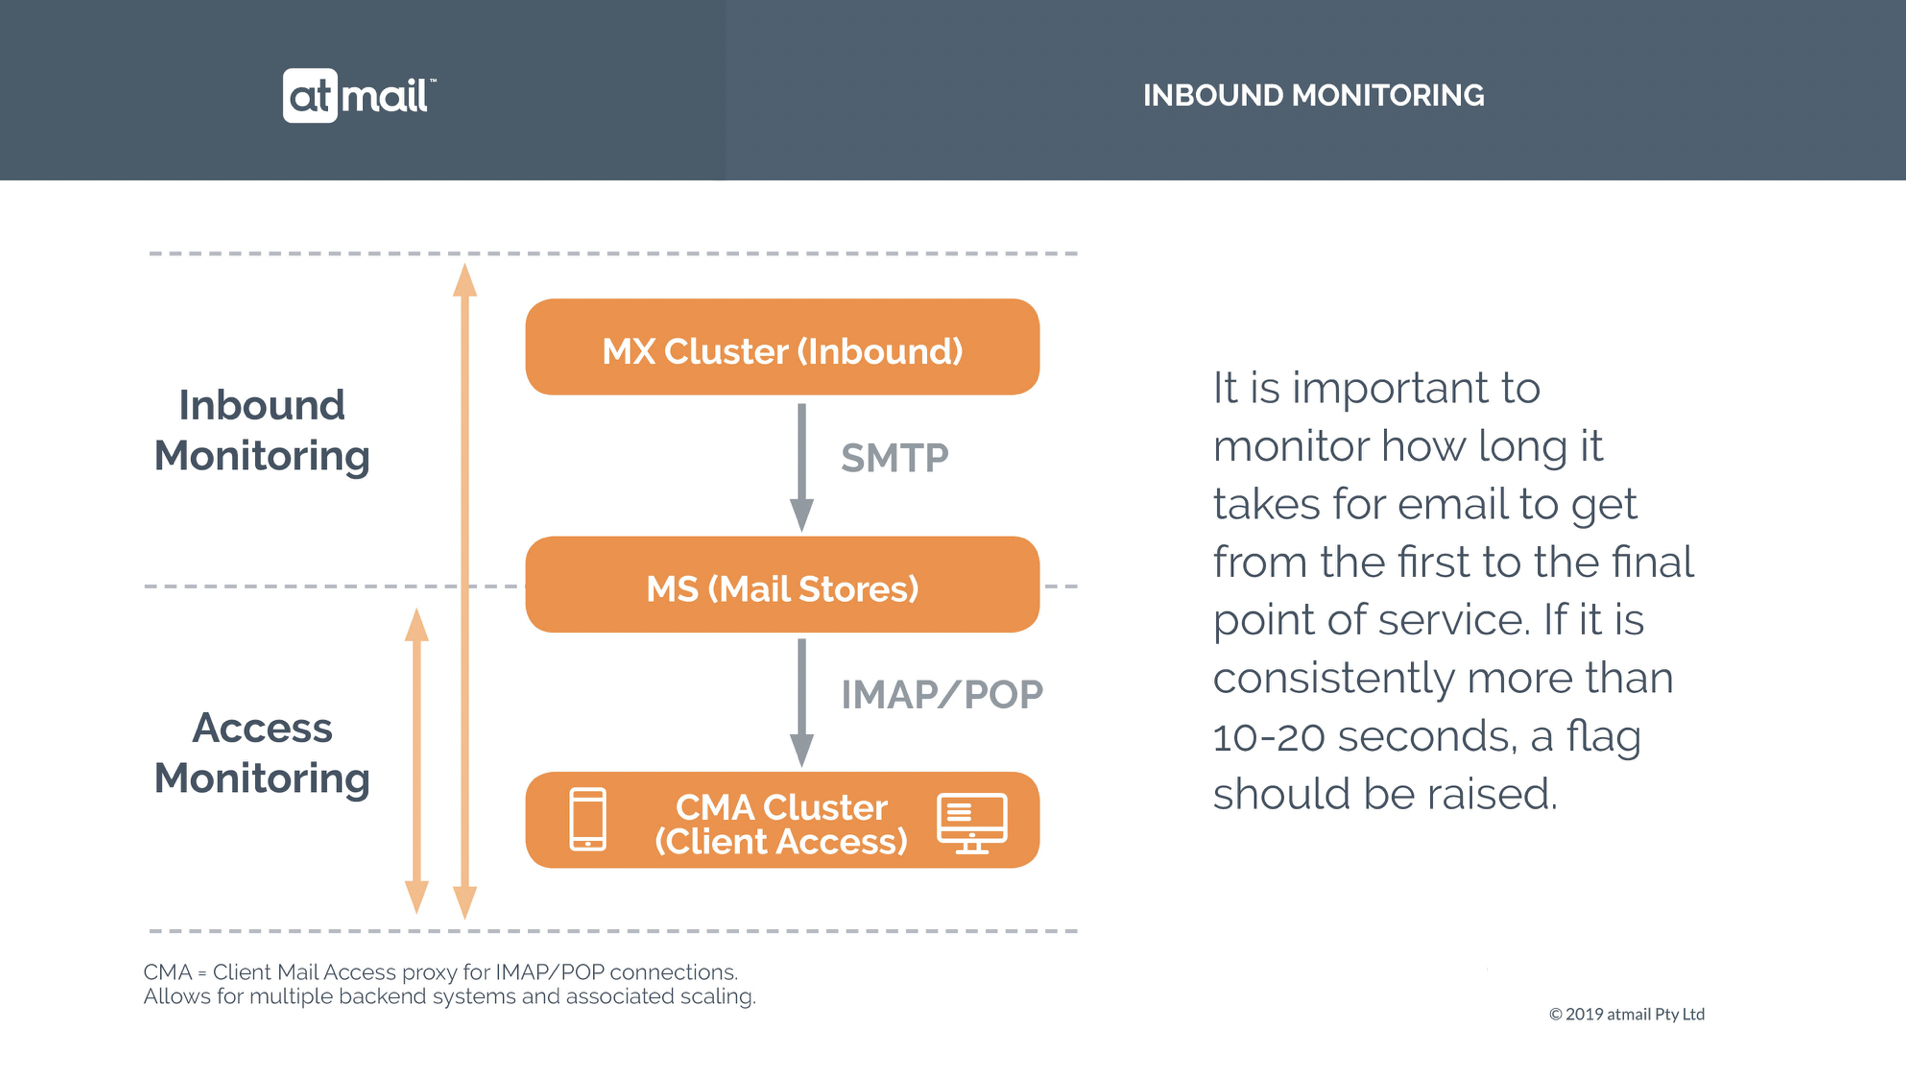
- Time delays in mail delivery.
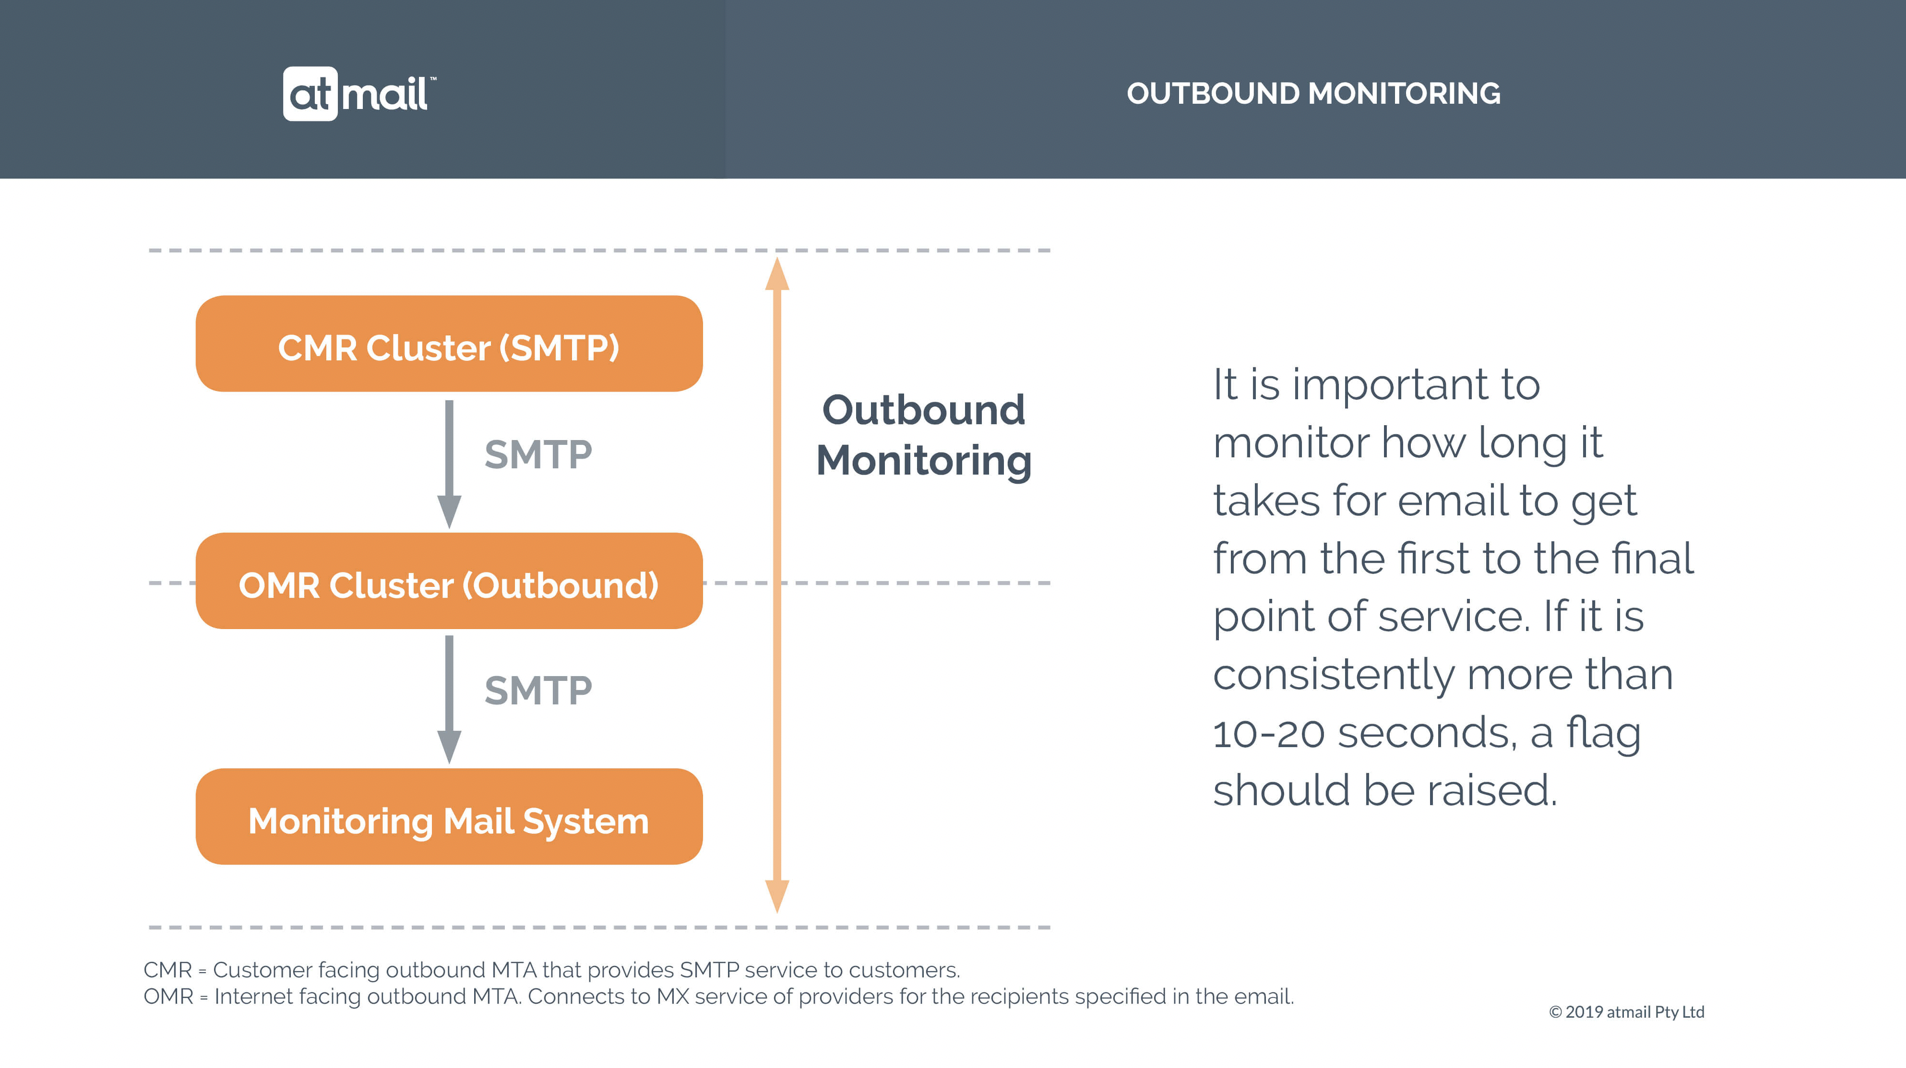
- As your customer base increases, you can also keep an eye on how the general infrastructure is keeping up. Is there a steady increase in the time it takes to deliver email? If so, maybe some components in the MTA infrastructure require additional resources.
- Optimisation issues.
- If you have a cloud environment, you can identify certain usage patterns to check that you are effectively cost optimising your resources (e.g. allowing you to shut down some servers overnight when fewer people are using the email system and then spin them back up in the early morning).

Types of Monitoring
Component monitoring
Let’s take the MTA, as an example. There are a few key metrics to monitor here that can be done quite quickly, namely central processing unit (CPU), memory and disk utilisation. Those metrics will not show if the email service is healthy, but they will definitely indicate if the email service is unhealthy.
The key metric that we recommend tracking is the queue depth of the MTA. As long as that is low, emails are being processed and the MTA is doing what it is supposed to. The same can be applied to the other components in the infrastructure.
Specific systems to monitor could include (but are not limited to):
- IMAP proxies
- Mailstores
- MX servers
- Routing servers
- SMTP servers
- Outbound servers
- Webmail servers
- Admin servers
User experience monitoring
To put it simple, it’s best to try to have automated scripts do what your user would do: get email; send email; and receive email. The most basic version is to check that it works.
The next step is to add a timer around the operation and track that over time. This is ideally done from an external resource to the mail service itself, to give the most user-like experience possible.
Specific systems to monitor could include (but are not limited to):
- IMAP access (login + read emails)
- Inbound email (MX server through to mailstore delivery)
- Outbound email (SMTP server through to delivery on remote end)
- Webmail login
- Load mailboxes (i.e. switching folders)
- Calendar
- Contacts
What does atmail monitor?
atmail monitors all components individually, 24/7/365, and also user experience monitoring for all major services. This is a neverending activity. Every geography and every customer brings their own usage profile of the services provided, which prompts tweaks to our monitoring and alerting setup. We are always finding new and better ways to monitor on a regular basis, to ensure that our service quality is always improving, and our systems are always being tuned to the various usage patterns that we see.
What monitoring and alerting tools does atmail use?
We use a wide variety of tools, including both off-the-shelf and proprietary products.
External technologies that we use include: AWS CloudWatch and CloudWatch Alarms; AWS Simple Notification Service (SNS); AWS Simple Queue Service (SQS); AWS Lambda; Opsgenie; Monit; Nagios; Graphite; and Prometheus.
As described earlier, alerting relies on the event generation that comes out of the various monitoring solutions. These events indicate when a component is not performing as expected.
The most elementary alerting process is to simply pass that on to the alert management system (for instance Opsgenie, PagerDuty or similar) in order to get someone’s attention to look into the issue. At this stage, it is very difficult to ascertain the severity of the event, as every single alert is passed on without triaging.
In an ideal case, additional business rules are in place to identify severity or even attempt auto healing. For instance, when a single MTA reports a high queue depth, it might just be a problem on that server. Auto healing can safely terminate it and replace it with a new one. If, however, the entire cluster reports a problem, then it is time to escalate to the engineering team with a high severity level.
Tools such as Opsgenie and PagerDuty are very powerful in terms of making sure that different levels of severity get appropriate responses. The other thing that they are good at is escalating an issue to additional people, if for some reason the on call people are unavailable.
Debriefing and improving
Without effective monitoring, the loss of a fully functioning email service is a serious organisational risk.
The important thing with monitoring and alerting is to continuously improve it. New types of issues come up and the environment will continuously change. That’s why debriefing, combined with regular reviews of the process, are an essential part of the continuous improvement process.
At atmail, we monitor, alert, track, debrief and improve on a daily basis. Alerts are reviewed and solutions are implemented to prevent future alerts and/or to automatically deal with them. It is important to us that our service is running stable (and ideally, our team gets a good sleep).
For this to work well, we believe it is also important that the people who write the code, run it. As they say, an engineer getting woken up in the middle of the night due to their own mistakes is going to fix them very fast and not make the same mistake next time.
New to atmail?
atmail is a cloud services partner for telcos, ISPs, WISPs and other service providers. With 20 years of global, white label, email expertise, you can trust us to deliver an email platform that is secure, stable and scalable. We power more than 170 million mailboxes worldwide and offer modern, white-labelled, cloud hosted email with your choice of US or (GDPR compliant) EU data centres. We also offer on-premises webmail and/or mail server options for organisations who wish to keep their systems in-house. To find out more, we invite you to reach out to us here.
Interested in our white papers?
Download our free white papers here.
More Posts